CFPB Issues COVID-19 Mortgage Servicing Response Metrics Report
Hello compliance friends, welcome to another Wednesday blog post! This one is very special, because it is one of my most favorite days – National Fajita Day! Fajitas are one of my favorite dishes, so I will definitely be whipping up a batch for dinner tonight.

Now that we all know what’s for dinner, there’s another item on the menu to discuss: the CFPB’s COVID-19 Mortgage Servicing Response Metrics Report was released on August 10, 2021. The report details the pandemic response of 16 large mortgage servicers who submitted data to the Bureau, upon its request. The report focuses on data around call metrics, COVID-19 hardship forbearance enrollments and exits, delinquency, and borrower profiles.
Call Metrics
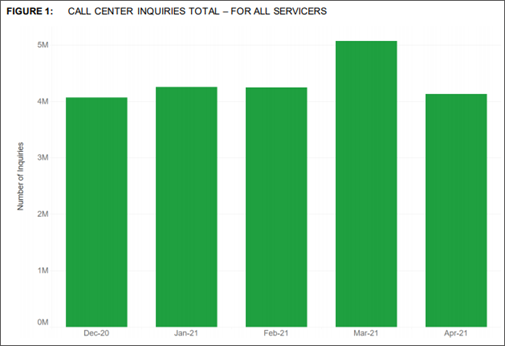
The CFPB requested data from the servicers to gain insight on call center volume and responsiveness. All sixteen servicers provided information regarding the number of call center inquiries received each month, the average hold time/speed to answer, phone call abandonment rates, and the average time it took to handle calls.
From December 2020 through February 2021, overall call volumes remained steady, hovering just over four million per month. However, in March 2021, call volume exceeded five million calls, most likely due to expiring forbearances. The bureau included the following chart in its discussion on call volume.
The report also discusses the average speed to answer (i.e., how long borrowers had to wait on hold), which “remained relatively stable,” at an average of 2.7 minutes for the reporting period. There were a couple of outlier servicers, with much longer than average hold times. A somewhat-related metric that was analyzed was the average call abandonment rate (AR), which data shows increased almost across the board from December 2020 to March 2021, and then decreasing in April 2021. The bureau noted, though, that “[t]he number of call center inquiries showed no clear correlation to AR. In other words, the servicers with the highest report numbers of call center inquiries did not each have relatively high AR.”
The final metric discussed in this section is the Average Handle Time (AHT), or the average length of calls. The data shows a wide range of AHT, anywhere from 5.6 to 16.4 minutes. The range may be attributed to how the data was submitted, since some servicers did not aggregate all of their call data, but instead “provided separate data for call centers with different functions, which handle different types of calls.” Most servicers AHT was stable throughout the entire reporting period (December 2020 – April 2021). Overall, the CFPB reports that call metrics remained stable, with only a couple outliers in each category. For those outliers, the bureau made the recommendation to assign “additional staff and resources to address higher inquiry volume.”
COVID-19 Hardship Forbearance Enrollments & Exits
The bureau requested metrics on pandemic-related forbearance or other payment assistance programs offered by servicers to their borrowers. The programs included CARES Act forbearances and similar programs.
The data shows that, for the reporting period, the most hardship requests were made in December 2020, with significantly fewer requests in January and February of 2021. March and April both indicate an increase in requests, but still far fewer than December, as illustrated in the bureau’s chart.
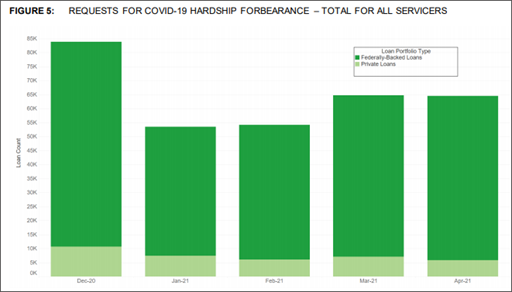
The report notes that the bureau also requested information on denied COVID-19 forbearance requests, which were “consistently low,” with denials ranging from 0 to 500 each month, and “only one servicer reported more than 200 denials in any month of the reporting period.”
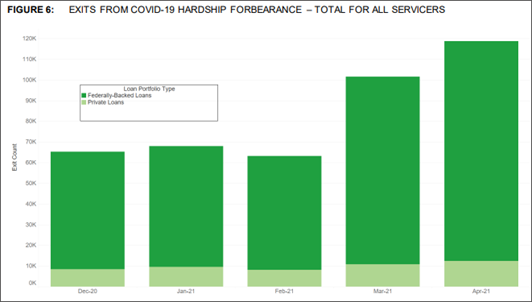
The report also details reported data around loans exiting COVID-19 forbearance, and the status of those borrowers (i.e., how far behind they are in their payments). As we previously blogged, Regulation X was recently amended to provide temporary protections for borrowers exiting a COVID-19 hardship forbearance, which requires servicers to help resolve delinquency and “ensure a smooth transition” back into repayment, or to avoid foreclosure where possible.
The data exhibits a relatively steady number of forbearance exists from December 2020 through February 2021, with a jump in March and April 2021:
Delinquency
This section includes more visual representations of the data collected regarding delinquency rates for borrowers exiting forbearance, and delinquent borrowers who did not request forbearance. Delinquency rates, overall, ranged from “1% to 26%, with most servicers reporting rates between 5% and 13% during the reporting period.”
For borrowers exiting COVID-19 hardship forbearance, the data reveals that the number of delinquent borrowers increased consistently each month of the reporting period:
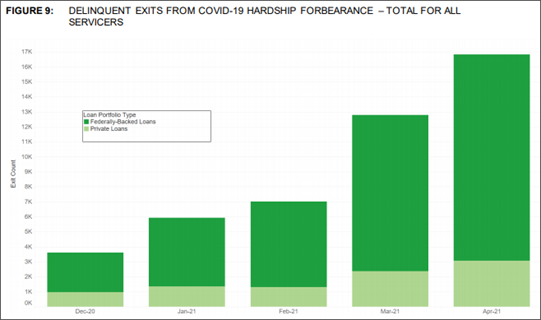
Across the board, the metrics reported show “significant variability” of delinquent forbearance exits among servicers, though most did see increased delinquent exit rates toward the end of the reporting period (March and April 2021).
Borrower Profiles
Lastly, the report details information received regarding borrowers’ Limited English Proficiency (LEP) status and racial demographics, to “understand if borrowers with LEP and racial minorities availed themselves of the CARES Act’s home mortgage loan forbearance provisions.”
Due to the discrepancy in the number of servicers who collected and maintained LEP status information and race information, and the differing methods used by those who do, comparisons in pandemic responses across servicers could not be made. However, the CFPB “encourages servicers to evaluate the fair lending risk related to servicing borrowers with LEP or within protected classes and ensure that their fair lending CMS is sufficiently equipped to identify and address the attendant risk of harm to these vulnerable populations.”
For more information, and to see all of the charts, data, and conclusions, head over to the full report on the CFPB’s website.